Client: Hennepin Healthcare Research Institute
Website: www.srtr.org/transplant-centers
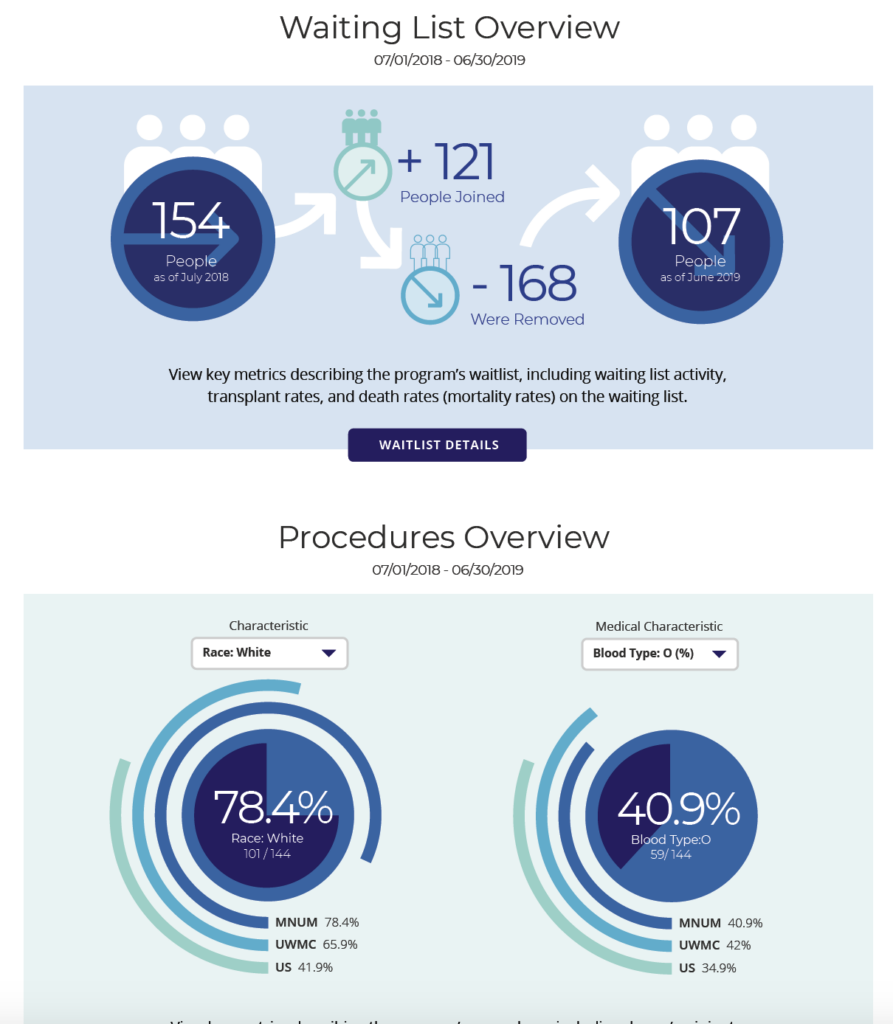
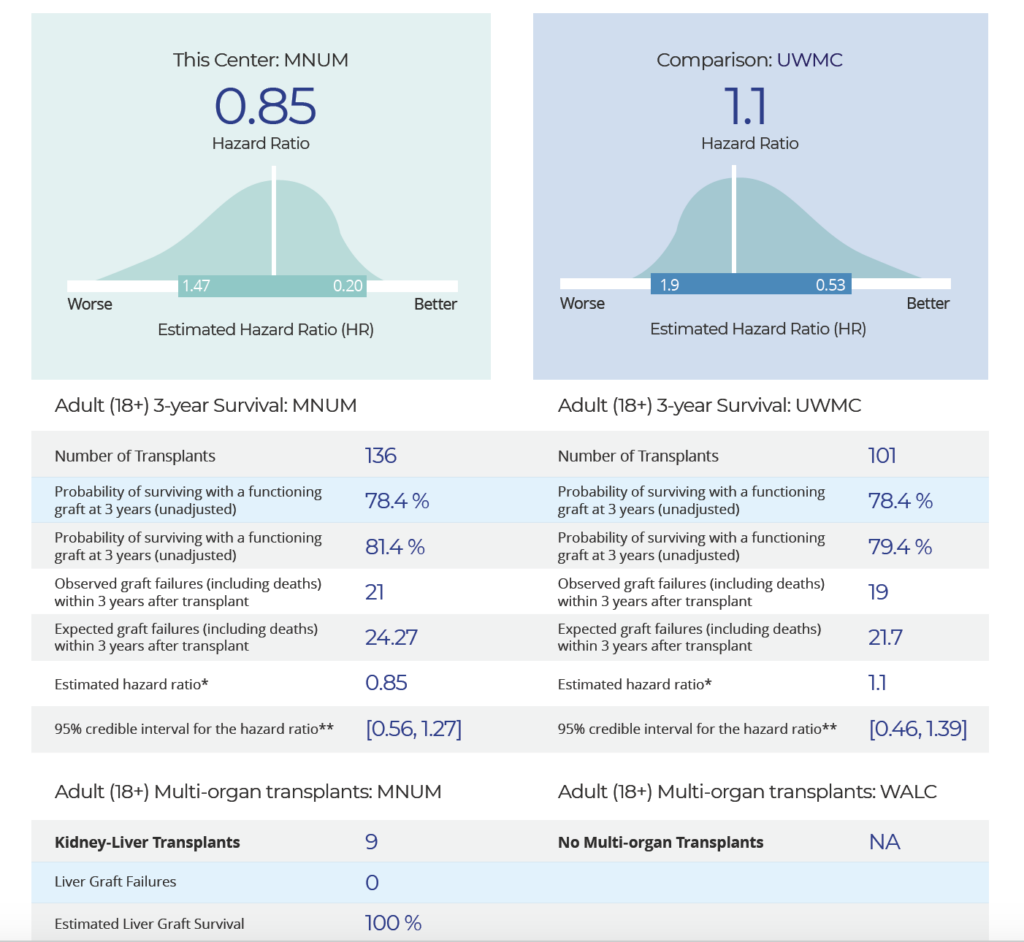
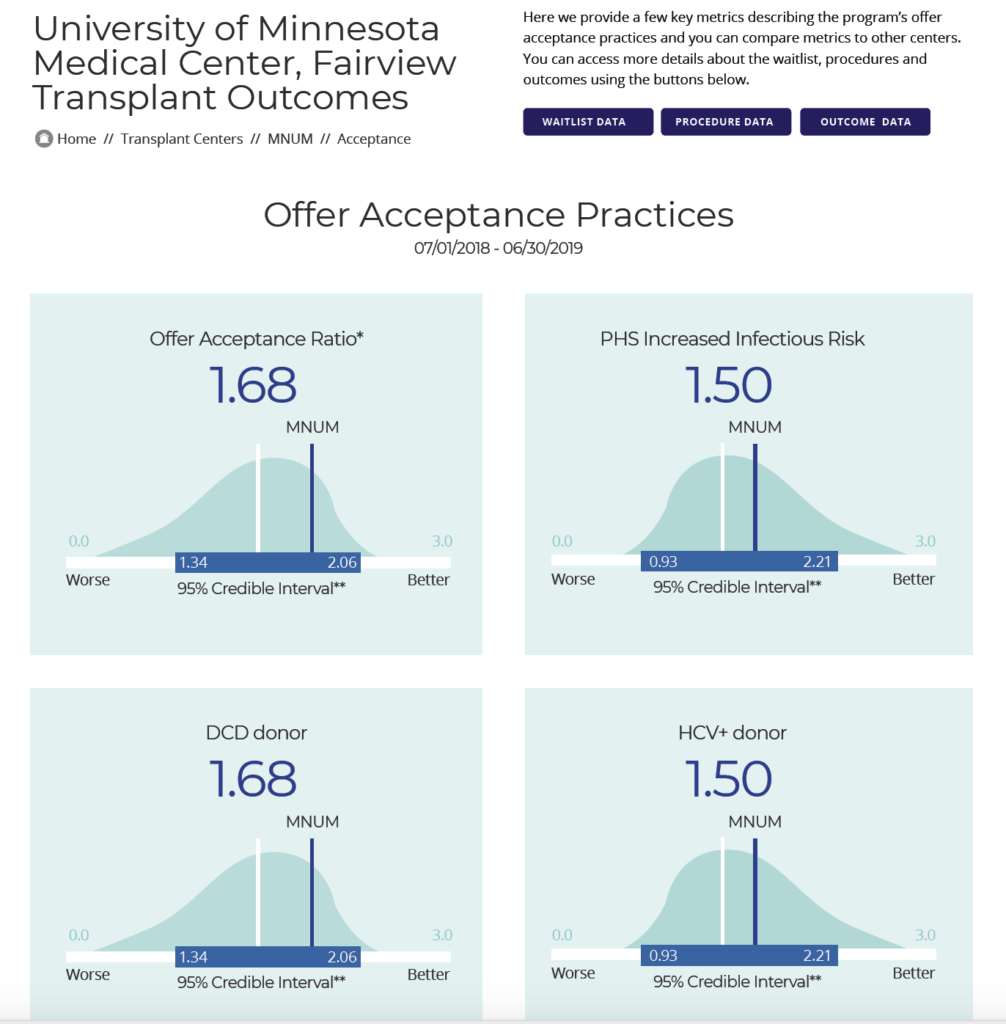
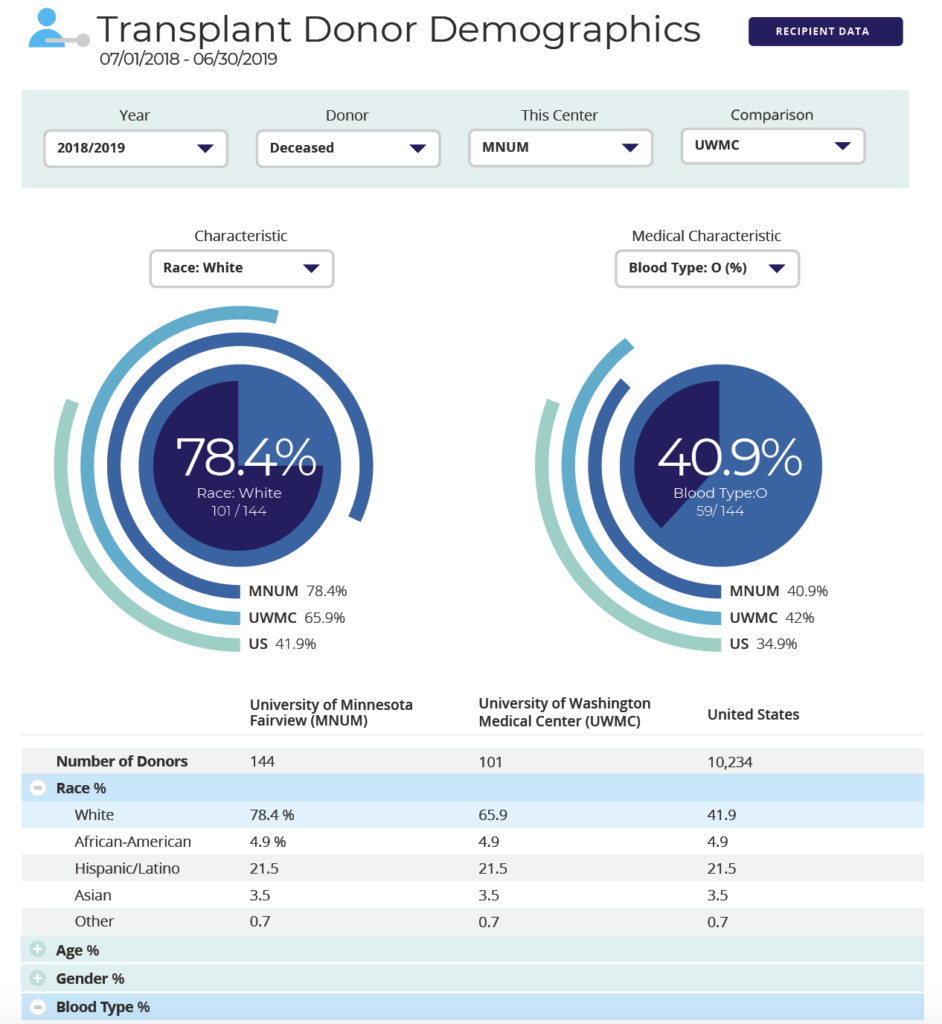
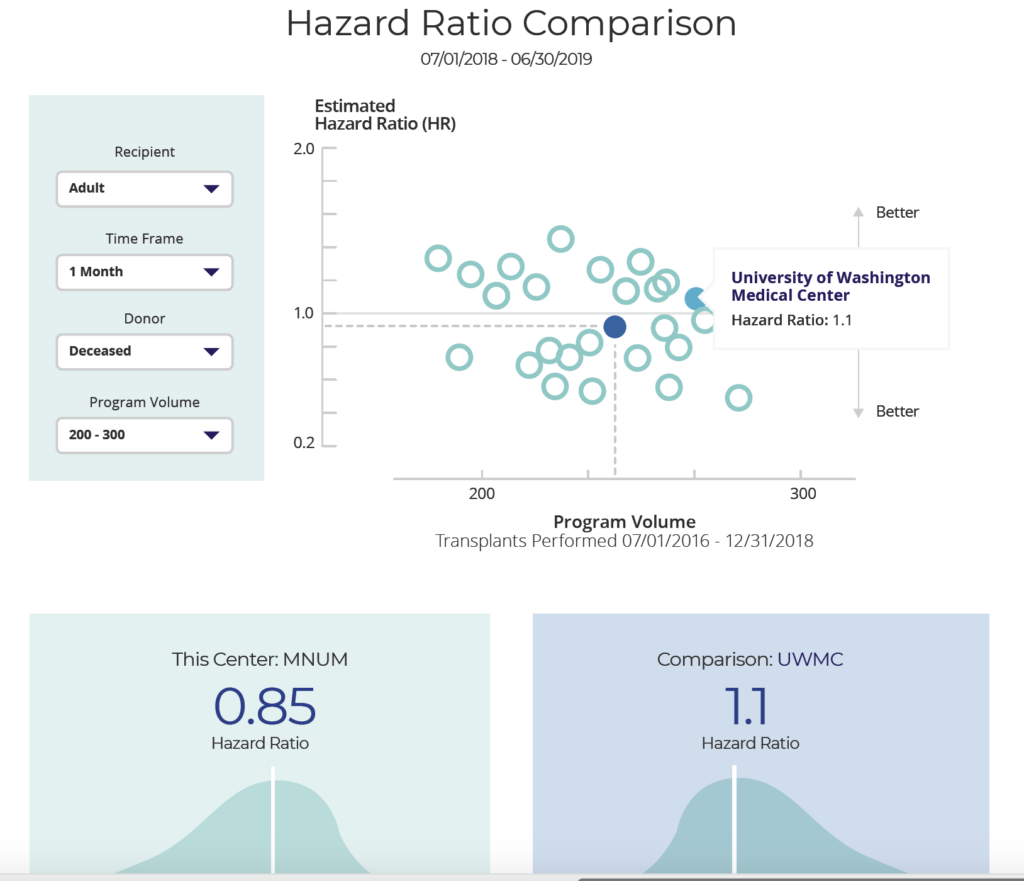
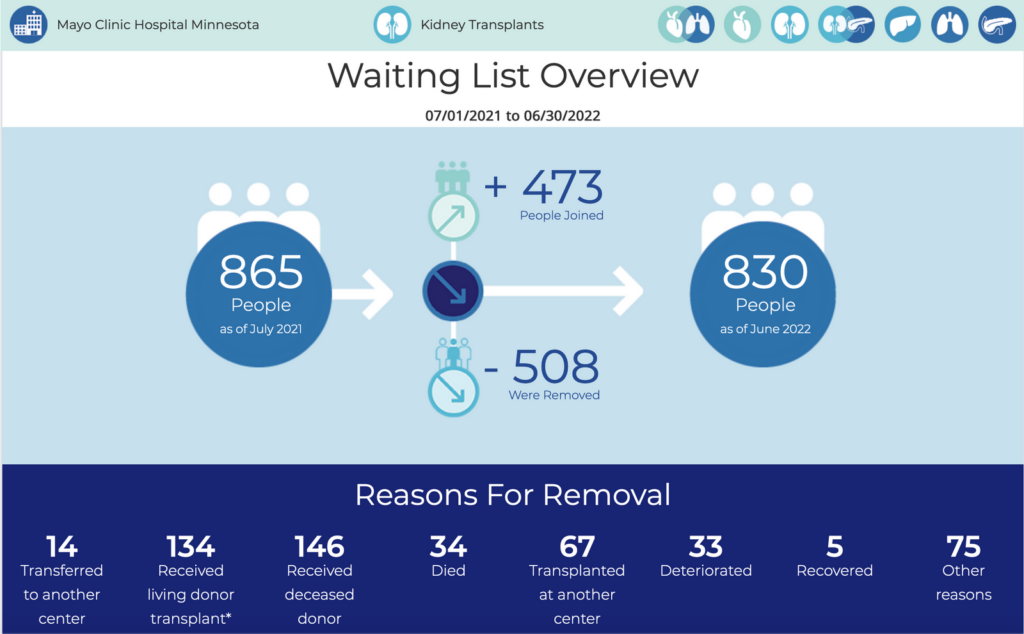
The Transplant Centers Interactive Report provides valuable data on a transplant program’s waiting list, organ offer acceptance rates, transplants performed, and patient outcomes following transplant.
We worked closely with the client bio-statisticians to identify key metrics and data sources that would be most valuable to their end users. This included developing ways to analyze and process the data, as well as creating visualizations that effectively communicate information to the different end users of the website.
We used interactive graphs and charts to present the data, allowing users to explore the trends and patterns in a user-friendly and intuitive way. By leveraging the power of R datasets, we were able to create sophisticated visualizations that effectively communicate complex information to a wide range of audiences – not to mention speed page load times.
Overall, our work on this project demonstrates the power of data visualization and management to provide valuable insights and inform decision-making in the healthcare industry. By leveraging the power of the React, HighCharts, .Net, and the R programming language, we were able to create interactive reports that effectively communicate complex information and provide valuable insights into the performance of transplant programs across the United States.