Client: Hennepin Healthcare Research Institute
Website: www.srtr.org/reports/opo-specific-reports
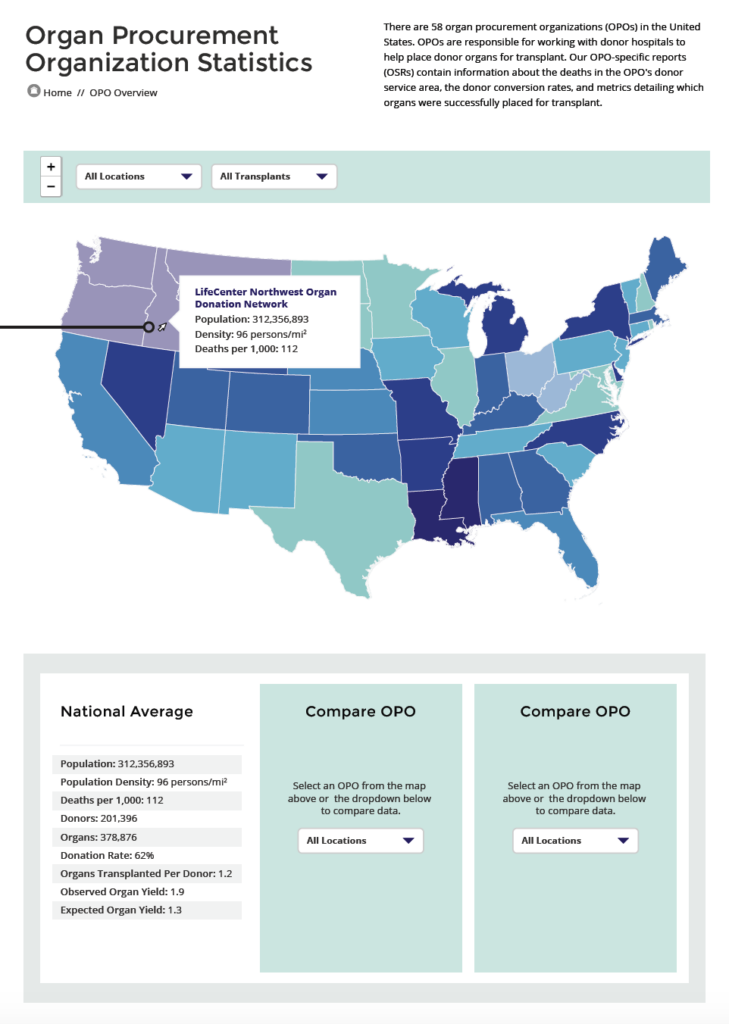
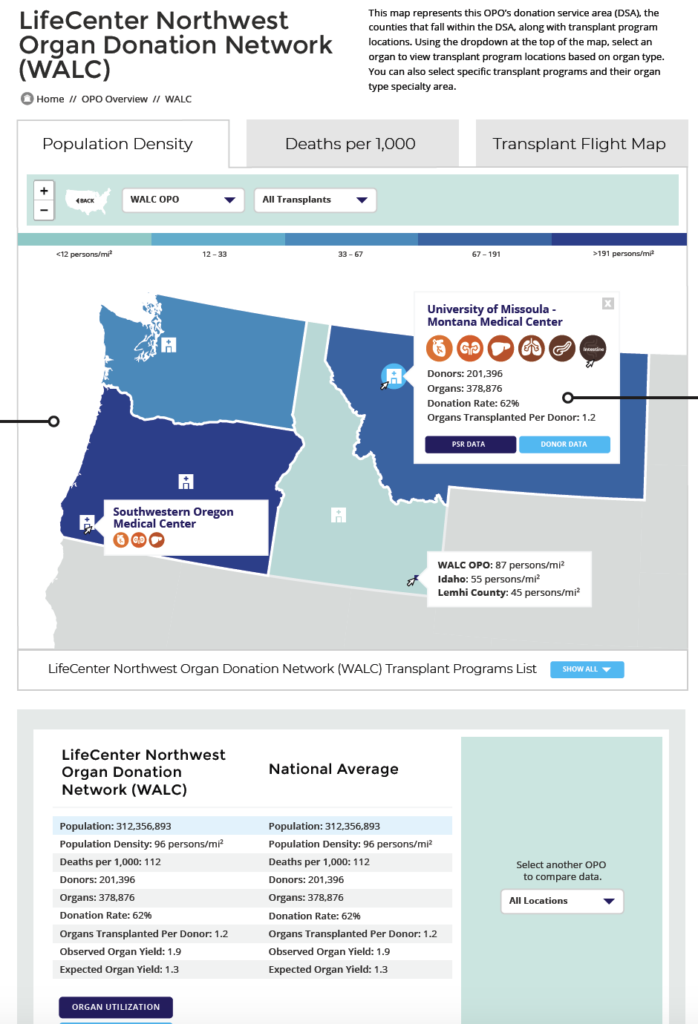
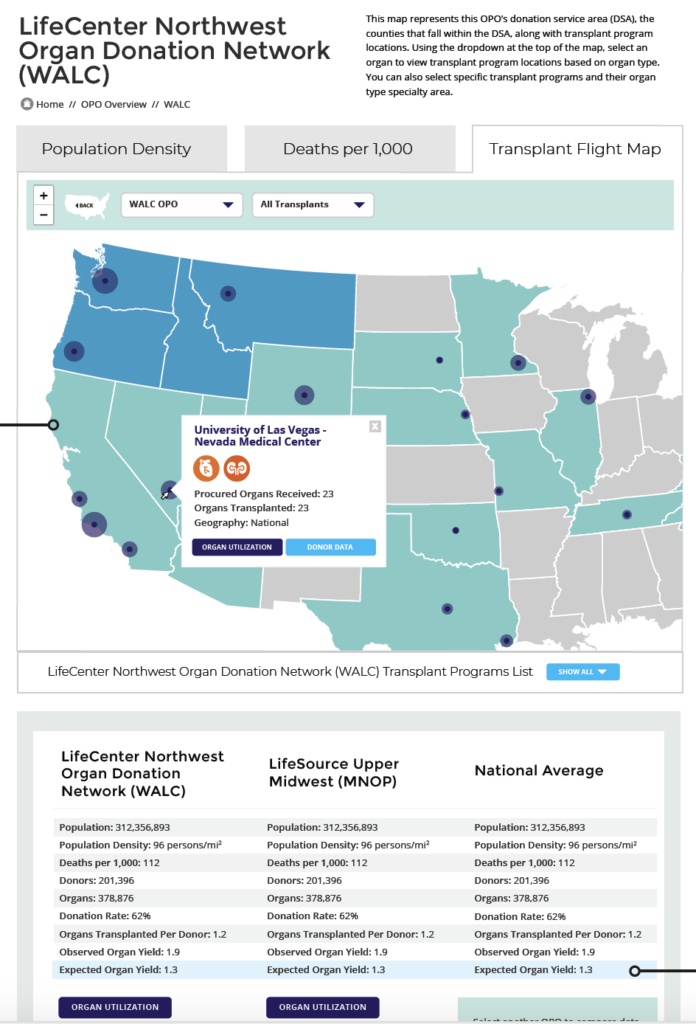
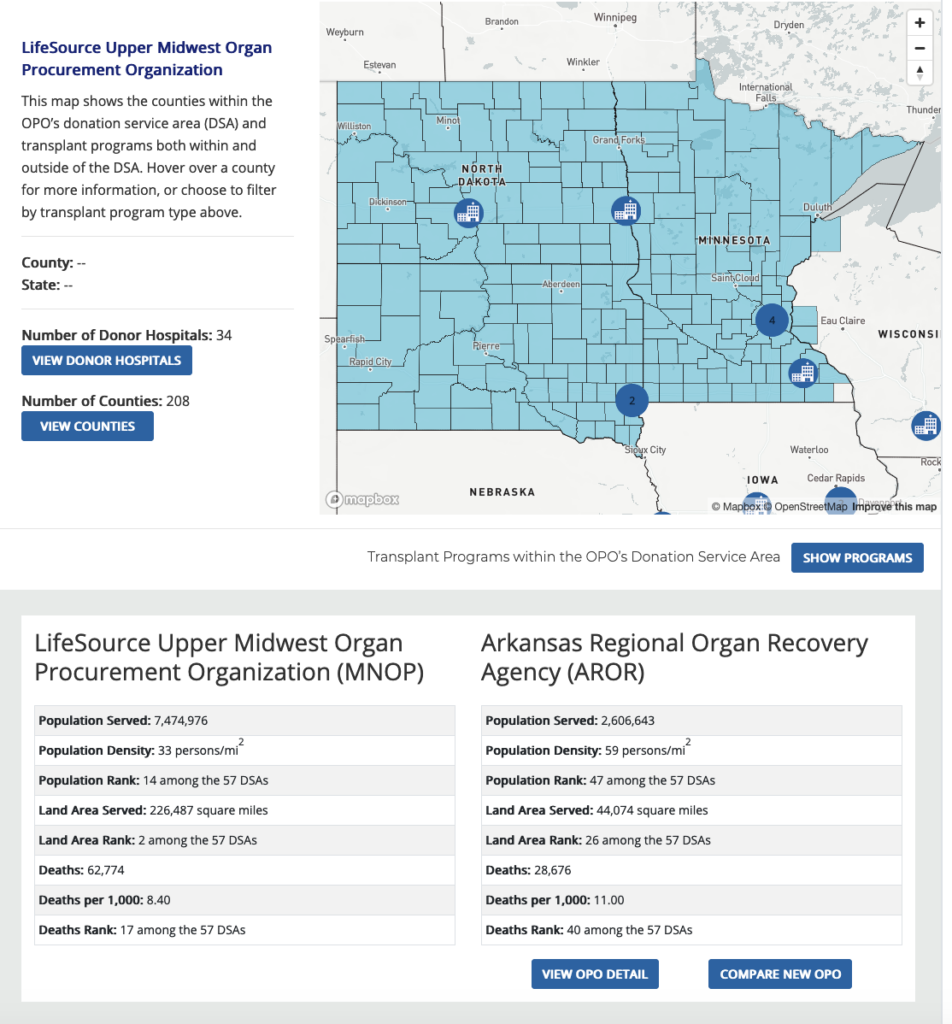
In this project we created interactive reports about various aspects of the 57 organ procurement organizations (OPO) and their donation service area (DSA). Our team worked closely with the team of bio statisticians, doctors and key research staff at the SRTR to identify the key areas of interest for their end users. These included the Overview, Population Density & Death Rates, donors procured by the OPO (Donor Data), donation rates from eligible deaths (Donation Rates), utilization of donor organs (Organ Yield), and the programs receiving organs from donors procured by this OPO (Programs Receiving Organs).
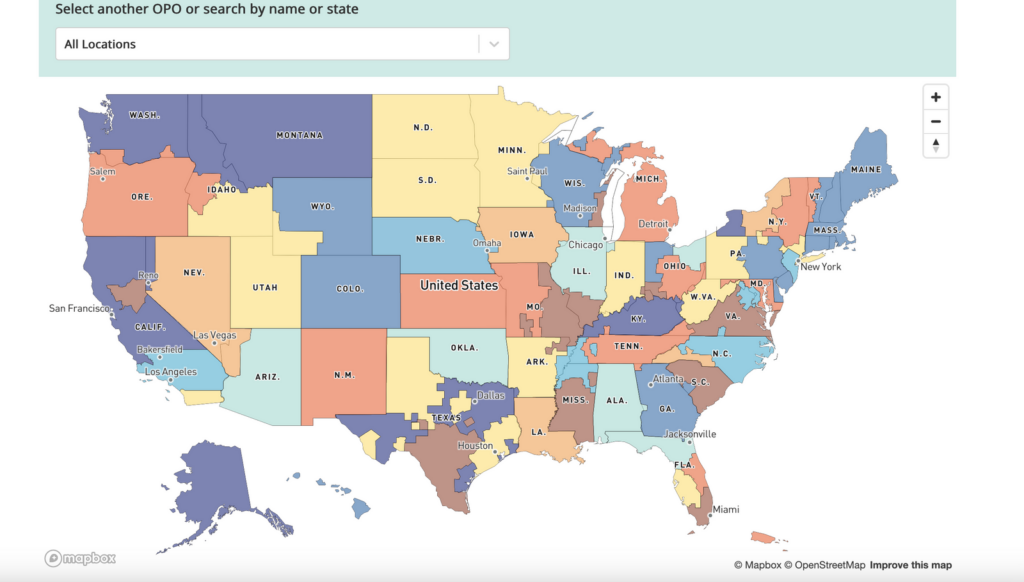
To achieve this, we used a variety of data visualization techniques to present the information in a clear and visually appealing manner. For example, utilizing GeoJSON we used interactive maps to display the geographic distribution of OPOs and their service areas, allowing users to easily see the coverage of each organization.
We also utilized Mapbox along with HighCharts’ charting and graphing capabilities to display data on donation rates, organ yield, and other key metrics. By using interactive elements such as hover-over text and filtering options, users were able to dive deeper into the data and explore the trends and patterns in greater detail.
In addition to the visualizations, we also tackled the challenge of consolidating data from multiple sources, including data generated through R programming language and geolocation services. This required close collaboration with bio-statisticians and data scientists to ensure the accuracy and completeness of information.